
Published on April 26, 2024 by Ashish Arora and Mansi Madan
Leveraged loans continue to offer some of the highest yields among major sub-asset classes in the fixed income space, fulfilling their objective of providing protection during a slow post-pandemic economic recovery. However, given the expectations of interest rate cuts in FY24 (ending date month year), we believe that the income opportunity outweighs the downside risks of default, especially as peak rates revert to normal levels, boosting overall macro prospects. In this report, we cover trends in (1) inflation, (2) performance, (3) default rates, (4) effective yield and (5) repricing.
FY24 outlook – We see the US economy continuing to emerge from the COVID-19-pandemic-induced recession and sustained market expectations of possible rate cuts in FY24. Both these aspects, should they materialise, are likely to serve as growth catalysts for companies with leveraged loans, as lower rates make it easier for companies to grow, resulting in long-term value creation.
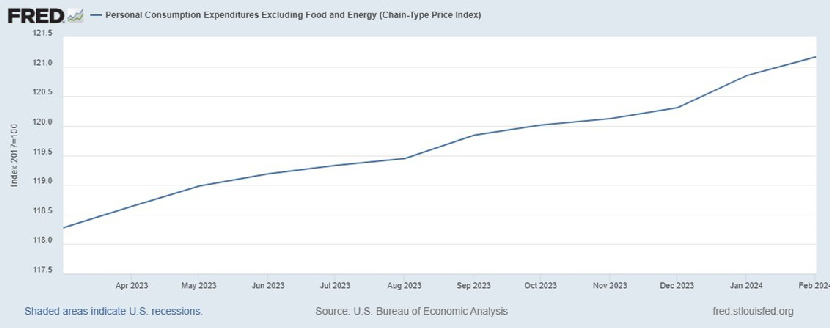
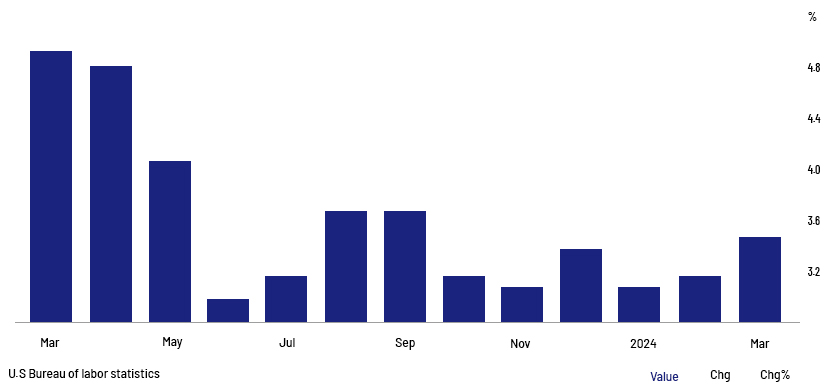
Inflation reaching the Fed’s 2% target
Inflation touched 3.4% in March 2024 (vs 3.2% in February 2024). However, core inflation bottomed at 3.7% annually since April 2021, down from 3.8% in February. June 2022 headline inflation of xx% was below the 1981 peak of 9.1%, but remains above the Federal Reserve’s (Fed’s) 2% target (https://tradingeconomics.com/united-states/inflation-cpi).
In March, median one-year-ahead inflation expectations held steady at 3.0% for a third consecutive month, as per XXXX’s March survey on consumer expectations. The estimate for three-year-ahead inflation edged up to 2.9% from 2.7%, while that for five years ahead inched lower to 2.6% from 2.9%. The Fed projected core inflation at c.2.6% at end-2024 and 2.0% at end-2026. In the last FOMC meeting in March, the Fed kept the rate unchanged at 5.0-5.25%. Citing concerns over the recent uptick in inflation and mixed economic data, the Fed announced it would not commit to rate cuts. Nonetheless, based on the stronger-than-expected US CPI, financial markets are pricing in a July or September start to the Fed’s rate cuts vs the earlier expectation of cuts from June.
Performance of leveraged finance universe – Considering the Leveraged Loan Index’s performance in the past year and the past three years globally and in the US, we believe past performance is not a proxy for future returns. In our view, FY24 returns will likely diverge from the forecasts, with the Fed likely to hold rates steady or cut them. A reduction in the base rate by the apex bank would spurt buyout activity among private equity firms and increase the number of LBO deals entering the market in the second half of the year. This would boost investor returns and drive new financing transactions and new-issue premiums to fund these deals.
Global leveraged loans – The Morningstar Global Leveraged Loan 100 Index measures the 100 largest facilities’ performance in the world leveraged loan market. It is a fixed-weight composite index, with the Morningstar LSTA US Leveraged Loan Index accounting for 75% of the weight and the Morningstar European Leveraged Loan Index making up 25% and a 2% cap on individual loan weight.
Morningstar Global Leveraged Loan 100 Index (one-year returns)
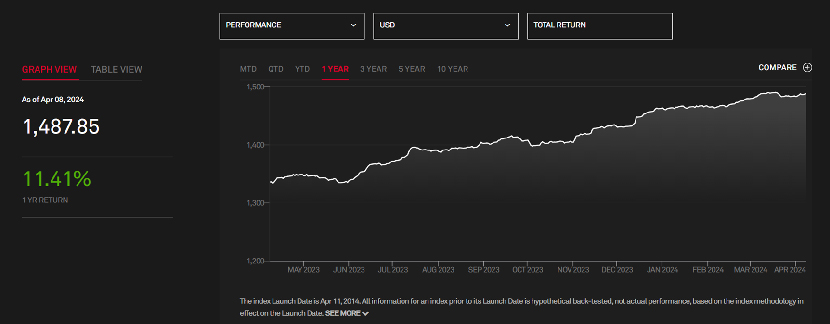
Source: SPGlobal
Morningstar Global Leveraged Loan 100 Index (three-year returns)
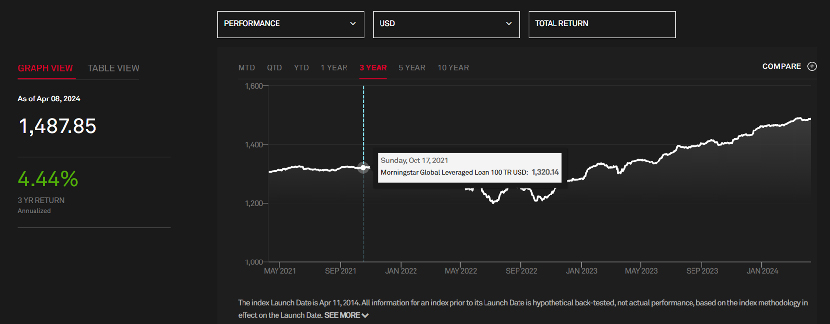
Source: SPGlobal
US – This Index assesses the 100 largest US leveraged loans’ performance based on loan outstanding. The following charts produce data across the one-year and three-year horizons.
Morningstar LSTA US Leveraged Loan 100 Index (one-year returns)
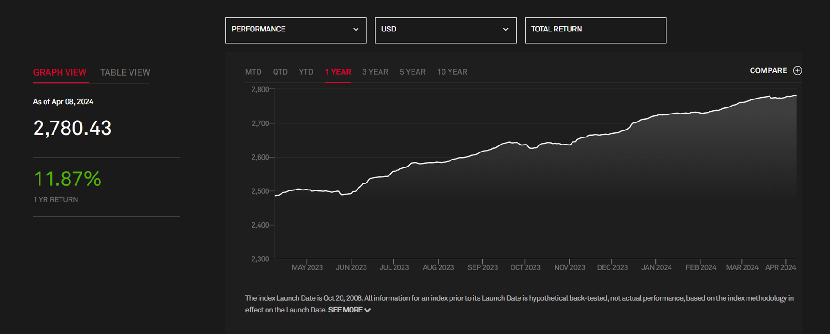
Source: spglobal.com
Morningstar LSTA US Leveraged Loan 100 Index (three-year returns)
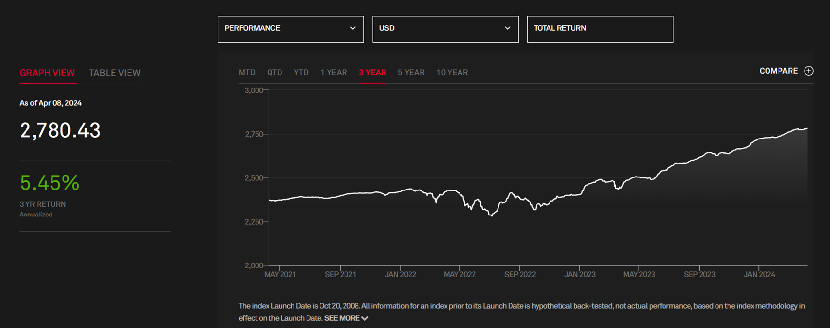
Source: spglobal.com
Comparison of performance across fixed income – Based on 2016-22 annual returns (data as of 31 December 2022), the US leveraged loan asset class ranks third (4.4% CAGR) among six key fixed income sub-asset classes.
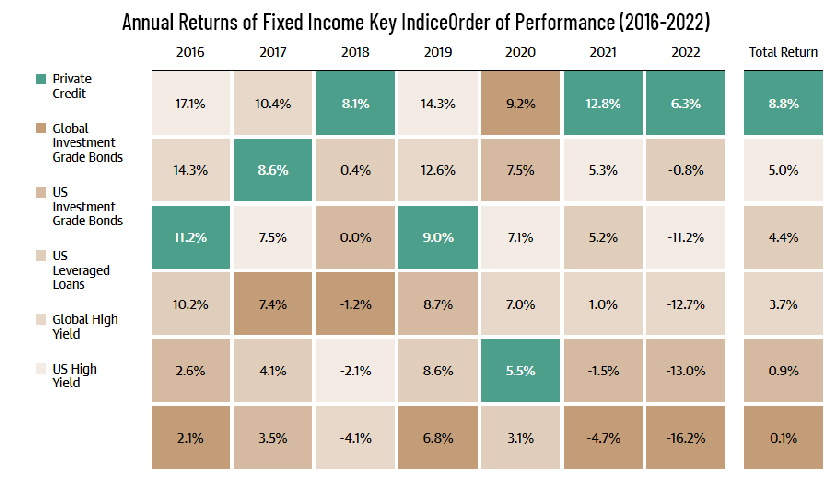
Source: Morningstar, Cliffwater
Default rates – With the expected interest rate cuts from FY24, we expect default rates to normalise, compared to the pandemic-induced peak rates.
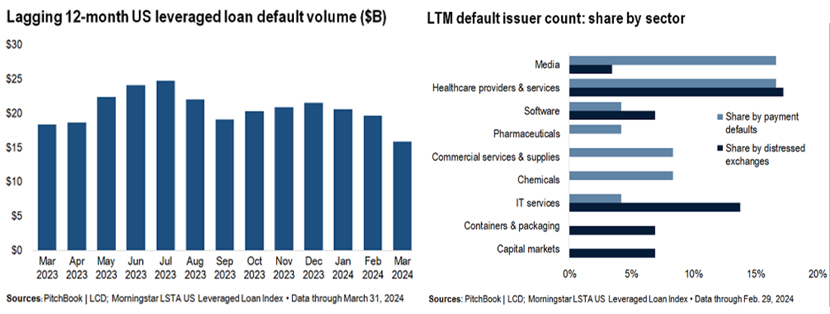
In March, default and restructuring activity slowed, as market sentiment and forward indicators continued to point in a positive direction. The share of performing loans priced below 80 – a marker for the loan distress ratio and a demonstrated indicator of heightened default – increased slightly to 3.51% from 3.35% in February – the lowest level since August 2022. However, the distress ratio remained significantly lower than the 4.54% at the end of YYYY (source: pitchbook).
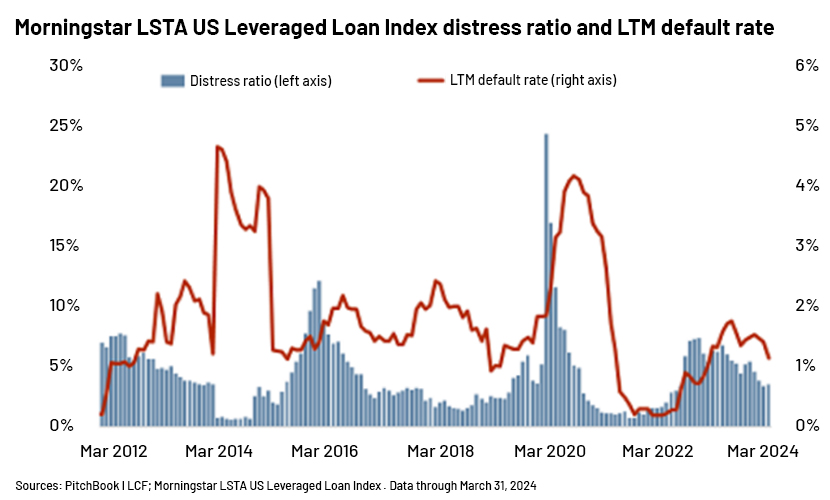
Lagging 12-month US leveraged loan default volume stemming from payment misses and bankruptcy filings in the trailing 12 months to March 2024 dropped to USD15.8bn (vs USD19.6bn in February and USD20.6bn in January). By sector, healthcare and pharmaceuticals accounted for 30% of the default volume in the last 12 months.
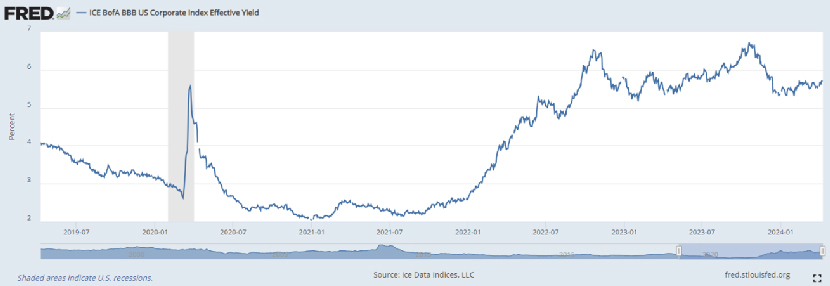
Effective yield trends – We also expect a relaxation in banks’ lending standards amid expected reduction in interest rates, likely leading to the issuance of new leveraged loans. The trends in effective yield across BBB, BB and single-B borrowers (source: FRED) are shown in the chart below.
For BBB US Corporate Index (effective yield: 5.71%)
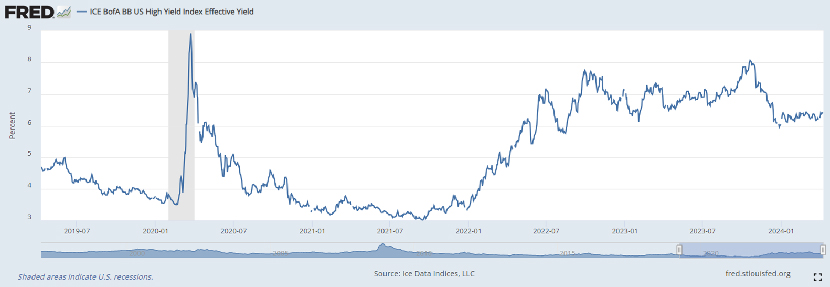
For BB US Corporate Index (effective yield at 6.41%, c.70bps higher than that for the BBB Index)
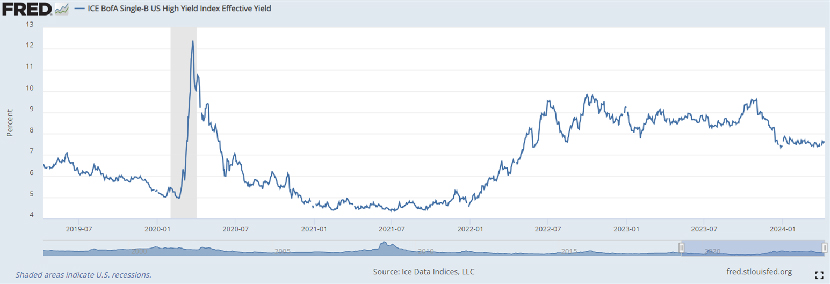
For Single-B US Corporate Index (effective yield at 7.60%, c.119bps higher than that for the BB Index)
Repricing at reduced interest rates
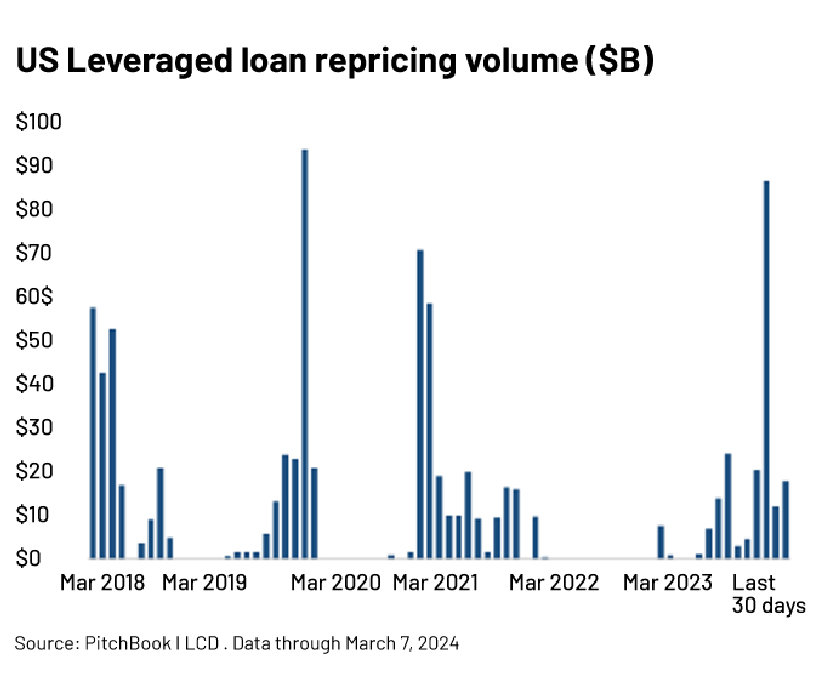
Repricing activity for US leveraged loans has surged once again driven by escalating secondary prices and persistently low new-issue spreads. Over the past month, borrowers have sought to reduce spreads on c.USD34bn of institutional term loans (a significant increase from the USD11.8bn repriced in February), with the majority opting for amendments. This follows an active January, when speculative-grade borrowers slashed spreads on USD86.8bn of institutional term loans –the highest level in four years. Year-to-date, loan repricing has totalled USD122.0bn, peaking since 2021. However, repricing activity slowed last month, as the secondary market rally paused amid the Federal Reserve’s more hawkish tone.
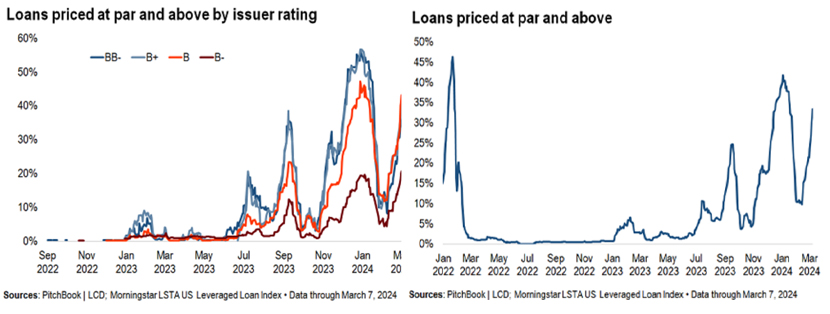
Loan repricing generally occurs when a loan is trading above its face value in the secondary market, as investors tend to prefer lower returns in such situations. The proportion of leveraged loans priced at par or above par fell to 10% in mid-February from the intra-year high of 42% in early January. Among borrowers with riskier ratings, those rated B-, the share of loans priced at par or higher, at 21%, has peaked since the Fed began hiking rates. For B, B+ or BB- borrowers, the ratio stands at c.40%, below the January 2024 peak.
We expect a slew of refinancing deals in FY24, with borrowers still looking to stretch the maturity of existing facilities or bonds, potentially lowering default rates. This would help most leveraged loans stay at or above par, improving repricing opportunities for all stakeholders.
Source:
What's your view?

Thank you for sharing your Comments
Share this on


About the Authors

Ashish has close to 17 years of experience in Investment Banking and Commercial Lending. His expertise spans across building credit models and performing comprehensive credit reviews on large and mid-sized corporates, focusing on clients’ repayment capacity. At Acuity, he is responsible for client engagement, setting up of pilot accounts and team management. Ashish has done his post graduation in Finance from Amity University.

Mansi has over 11 years of experience in Investment Banking and Commercial Lending. She is a part of the Leverage Lending division at Acuity Knowledge Partners and has experience across performing in depth credit reviews on large and mid-sized corporates and building financial models. Her expertise spans across various sectors including TMT, Healthcare, Power, Software and Industrials. Mansi has done her post graduation in Finance and Marketing from ICFAI Hyderabad.
 Blog
Blog
Driving the success of compliance functions: Acu....
In the fast-paced and highly regulated world of finance, compliance is not just a necessit....Read More
 Blog
Blog
A dovish Federal Reserve: a ray of hope for capi....
Rate cuts – a strategy for risk management The US Federal Reserve’s (Fed’s) Decembe....Read More

Like the way we think?
Next time we post something new, we'll send it to your inbox