
Published on July 29, 2021 by Mohita Gupta
Unlocking organisational success with the Voice of the Customer programme (an 8-part series)
This is part 4 of 8 our comprehensive series of blogs on the Voice of Customer.
Stay tuned for more blogs.
In Part 3 of this series, we learnt how data gathered from a VoC programme can be analysed and put to maximum efficient use. This blog lists the key metrics and KPIs used to determine the performance of the customer experience (CX) programme.
Perspective
VoC data is imperative to understand your customers’ needs and expectations. The data/scores collected from customers help derive the desired VoC metrics relevant for your business. The metric(s) enable a company to set priorities aligned to its customers’ needs, improving the customer experience and, hence, business results. The other crucial benefit is assistance in measuring the improvement of the company, product or service; by monitoring the metric(s) periodically, the company can track progress overtime.
But the question is which metric(s) to choose. Selecting the right metric(s) for your business can be a big challenge. There is more to return on investment (ROI) than increased revenue, so one needs to be selective to ensure the correct metric(s) are used to provide the right information for its unique business needs. Using the correct metrics ensures an organisation’s focus on the areas specified for improvement under the VoC programme. This blog highlights the most widely used metrics, so you could identify the ones most relevant to you.
Key metrics explained
-
-
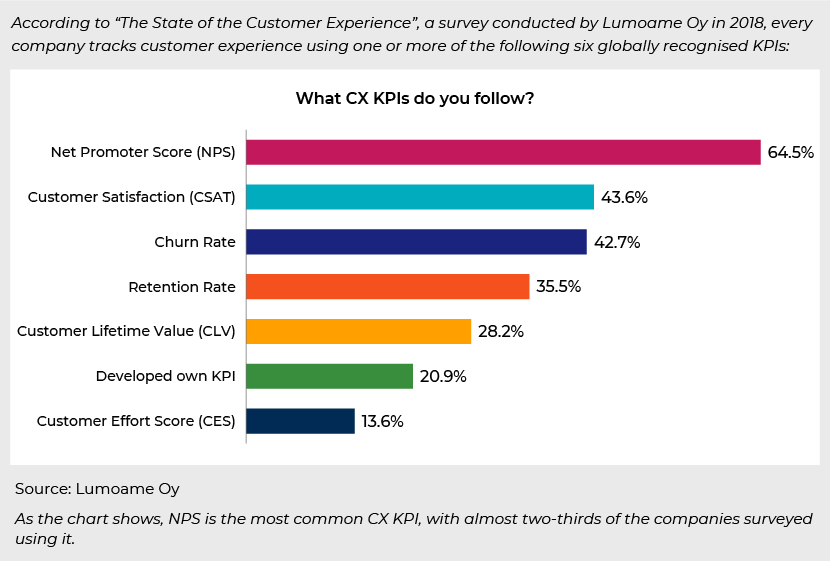
Net Promoter Score (NPS): NPS was first introduced in 2003 and has been used extensively since then. Most Fortune 500 companies, including Apple and Airbnb, benefit from its use.
-
Apple, a successful multinational technology company, is known for steady growth in customer satisfaction and loyalty. Apple’s NPS grew to 68 in 2021 from 58 in 2007. The company is focused on increasing this score, as it is directly related to its growth and customer retention levels.
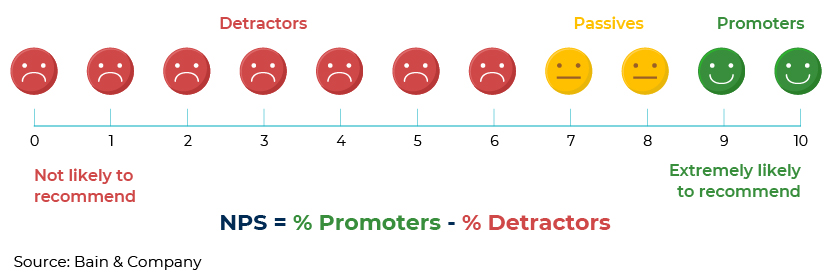
NPS measures customer loyalty and satisfaction with a brand or company based on responses to a single question: “On a scale of 0 to 10, how likely are you to recommend the product, service or business to a friend, family member or colleague?" Based on their answers, customers are classified into three categories – promoters, passives or detractors.
-
Companies use this classification to formulate a strategy to effectively reach the three groups. This could be by leveraging positive word of mouth in the case of promoters, closing the feedback loop in the case of detractors or designing strategy to convert passives to promoters.
NPS ranges from -100 to 100. A high NPS (or, at least, higher than the industry average) shows a healthy relationship between a customer and a company; customers are likely to act as evangelists for the company by spreading positive news about it and its products/services, and generate an incremental growth cycle.
It is the most widely used CX metric, as it is easy to understand, calculate and explain; however, there is a continued discussion on the degree of importance and flexibility NPS has to offer in comparison to other KPIs.
-
Customer Satisfaction (CSAT) Score: Typically used in transactional surveys, a CSAT score, also referred to as an overall satisfaction (OSAT) score, measures a customer’s overall experience of interacting with a product or service. The efficiency of a customer service department is usually measured using this parameter after a transaction or customer support ticket. The scale typically ranges from 0 (not at all satisfied) to 10 (very satisfied). The CSAT score is a very meaningful metric, as it is built on a customer’s immediate reaction to a product or service used.
-
Churn Rate and Retention Rate:
Customer churn, also known as customer attrition, is when a customer chooses to stop using the brand and/or shifts to some other brand/company.
-
Basic churn rate
= Customers lost during a particular period/number of customers at the start of the period
Sometimes, churn rate is also calculated as lost business value or revenue churn, i.e., the proportion of recurring revenue lost during a particular period. However, this metric value is a little difficult and complicated to study, as there is no one predictor of churn – one must consider both the experience parameters (e.g., unfriendly user interface, not-so-good customer support) and operational parameters (e.g., declining repurchases, reduced volumes) along a customer’s journey.
The customer retention rate measures the proportion of customers retained by the company over a specific period of time. The KPI is highly connected to the churn rate: the higher the retention, the lower the churn rate.
-
Customer Lifetime Value (CLV):
CLV measures how much potential revenue is attributed to a customer and how valuable each loyal customer is and can be to a business. It is calculated as the business value a customer brings over a specific time period or during the entire relationship with the company. The data is determined from the customer’s historical, current and forecast spending trends.
-
Customer Effort Score (CES):
The CES measures the ease with which a customer is connected to a service or a business. It is a transactional metric and should be used after product purchase or service interaction.
-
According to research by CEB Global,
-
The likelihood of repurchase by a customer is 94% in the event of an effortless experience vs only 4% in the event of a painful one
-
81% of customers who expended a high level of effort are likely to share their bad experience with friends vs only 1% of those who had an effortless experience
However, a key challenge with the CES is that the scale often does not match other scales in a survey, making it difficult for internal stakeholders to understand it against other metrics.
-
-
Customer Loyalty Index (CLI):
The CLI is a traditional measure of a customer’s loyalty towards a brand. Since loyalty cannot be expressed in a single number, the metric takes into account multiple factors such as likelihood to recommend, upsell and repurchase. It is not as widely used as it once was due to the complexity surrounding the need to weigh individual answers and the growing need for shorter surveys.
-
Customer Health Score:
This is a value that indicates the long-term prospect of a customer continuing with the company and becoming a high-value account with renewals/cross-selling/upselling opportunities or dropping off completely. The score ranges from 1 to 100. Several parameters are fed into the statistical model to calculate health scores and vary by company. It could become complicated; some companies use more than 25 parameters. Health scores should be built using just a handful of parameters that are most important to customers and the company in terms of providing long-term customer value and experience.
Amazon’s VoC dashboard provides sellers with the CX health scores for their customers. Amazon defines the CX health score as a metric that helps a seller understand how each of its offers is performing relative to similar offers, based on recent orders and customer feedback on products. This helps a seller identify issues such as wrongly labeled, damaged, or faulty products and inaccurate or incomplete detail pages, and take corrective action.
Linking CX metrics to additional data
All CX metrics need additional background information on a company’s operations. Analysing these metrics helps identify unhappy customers and formulate a plan of action to address their concerns. To get the most value and a more holistic view on how to influence customer satisfaction, a company needs to link customer feedback and metrics to additional data, such as employee feedback (an employee’s understanding of each issue), operational data (including customer engagement score, average resolution time and first contact resolution) and other loyalty metrics (including customer engagement, renewal rates and referral rates).
Conclusion
VoC metrics are important, as they cover multiple touchpoints across a customer’s journey. A common issue, however, is over-measuring, using multiple metrics. Companies need to make sure that the metrics they use can predict the outcome they are trying to avoid or promote. Many companies use these metrics because they think they are supposed to, but do not know how to derive value from them. They need to focus on growing their business and, therefore, set a metric(s) and targets only after assessing how they align with customer requirements, the impact intended to be delivered, and the organisation’s ability to deliver upon the metric(s) targeted.
How Acuity Knowledge Partners can help
Acuity Knowledge Partners has been providing research and insight support to diverse stakeholders in the technology sector – tech corporates, tech advisory firms and tech-focused investors – for over two decades. Equipped with a 360o view, we understand how customer data can be captured and analysed, and how the story emanating thereof can be leveraged to achieve better business outcomes. We help Fortune 500 technology corporations, mid-tier firms and start-ups leverage customer feedback on people, products and processes to remain flexible and better serve their customers.
References
VoC – Metrics Guide, Confirmit
What is Net Promoter Score, Confirmit, 2018
VoC – Using Customer Loyalty to Drive Growth and Profitability, Forteone, 2020
6 Most Popular Customer Experience Metrics and KPIs Explained Simply, Lumoa, 2018
7 VoC metrics you shouldn't ignore, CMS Wire, 2020
VoC – Customer Experience Health, Amazon
Measuring Voice of the Customer ROI: Which metrics are right for you?, Mycustomer, 2018
What is Voice of the Customer (VoC), InMoment
The Dos and Don'ts of VoC Metrics, CMS Wire, 2020
The Top Customer Service Metrics to Measure, Qualtrics
Are you really listening to what your customers are saying?, McKinsey, 2016
Tags:
What's your view?

Thank you for sharing your Comments
Share this on


About the Author

Mohita Gupta is part of the Private Equity and Consulting team in Acuity Knowledge Partners, Gurgaon. Currently, working for a financial technology firm in the customer experience domain. She has over 8 years of experience in strategic analysis, business research and consulting – has led projects for business leaders of large organizations across various industries and geographies.
She has worked with global clients and managed & executed a variety of engagements involving market sizing, competitive intelligence, survey data analysis, market / opportunity assessment across sectors, including financial services, food services, online gaming, transportation, consumer durables, FMCG, mining and others. Other areas of..Show More
 Blog
Blog
Why customer experience management has become a ....
Customer experience management (CXM) uses deep customer insights to deliver personalised e....Read More
 Blog
Blog
Wellness industry trends – 2023....
The wellness market has been around for a while. From the days of Jane Fonda’s workout t....Read More
 Blog
Blog
Banking trends in 2023....
In addition to increasing financial volatility, the pandemic made the banking sector rethi....Read More
Like the way we think?
Next time we post something new, we'll send it to your inbox