
Published on November 18, 2020 by Subhajeet Kumar Roy and Vidhi Bhamra
The adoption and enhanced use of alternative data along with BI platforms has become popular in the financial sector in recent years. Alternative data helps provide unique insights, enabling evidence-based investment decisions. Buy-side firms spent USD1.1bn in 2019 on integrating alternative data with their investment processes and are likely to spend USD1.7bn on this process in 2020.
While the use of alternative data is increasing, BI applications play a vital role in its adoption by investment management practitioners. We believe understanding the alternative data landscape, BI platforms and strategic implementation is key to unleashing the true potential of this data journey.
The alternative data landscape – a new horizon beyond financial filings:
Driven by the high usage of electronic devices, a significant amount of data has been generated every second over the past decade via means such as newsfeeds, online communication, social media posts and product reviews. Alternative data, also known as “exhaust data", has its roots in finance, with investment companies starting to use non-traditional data about a company to extract unique insights on the company’s performance from sources other than regular company filings. Hedge funds were the key innovators in this space, but private equity (PE) and long-only managers have joined them subsequently. For example, an investment manager can leverage data from various entertainment platforms (such as Netflix, Hotstar and Prime) to analyze public interest, geographical coverage, and future release plans of entertainment companies, which in turn would help assess their near-term operational performance.
Alternative data is extremely valuable to Wall Street, as it predicts the behavior of market variables. Contemporaneous correlations are insufficient to compete in this fast-paced world. Alternative data ensures signals are available sufficiently ahead of market action so that one can trade on and profit from it.
Unleash the true potential with BI
With large amounts of alternative data being accessed from different sources, BI becomes a mandatory platform for analyzing and extracting insights for making better-informed, data-driven decisions. In addition to providing a historical, current and predictive view of business operations, BI reports have numerous other benefits, starting from identifying market trends and providing a comparative and competitive analysis to optimizing revenue and spotting potential issues or problems.
Unlike the limited data-handling capabilities of the traditional reporting tools, modern BI platforms have a cutting edge with their in-built data-handling and data-modelling functions. Along with multi-cloud support and analytical capabilities, modern BI tools offer users increased flexibility and accessibility with an intuitive interface, enhancing the customer experience. Since they follow a bottom-up approach, their data architecture is such that the data can be looked at from an overall perspective vis-à-vis drilling down deep into all levels, assisting slice-and-dice analysis. Unlike traditional reporting tools that display static charts, modern BI platforms enable looking at real-time visuals.
Before visualizing any dataset using BI tools, one needs to understand some prerequisites. For instance, we need to ensure that the data is clean and in a readable format, and then move to preparing and storing the data in a data warehousing application or on the cloud. We then need to analyze the main objective of report creation and choose the visuals best suited for the dashboard. For instance, to show trends over time for one variable, one could use a line chart, and to show the relationship between two variables along two axes, one could go for a scatter/bubble chart. Considering that the end users of these reports could either be top-level stakeholders, data analysts or marketing managers, one needs to ensure that the final dashboard displays dynamic information in the simplest form and is easy to use and comprehend.
Let us now understand the use of BI in alternative data analysis with an example.
The following case study is based on hospital utilization data covering all US states compiled from the two main sources that provide this data:
-
Health and Human Services (HHS) Tele Tracking
-
Reporting provided directly to HHS Protect by state/territorial health departments on behalf of their healthcare facilities
The respective links are provided in the bibliography.
The following BI report created using Microsoft Power BI helps us analyze hospital utilization.
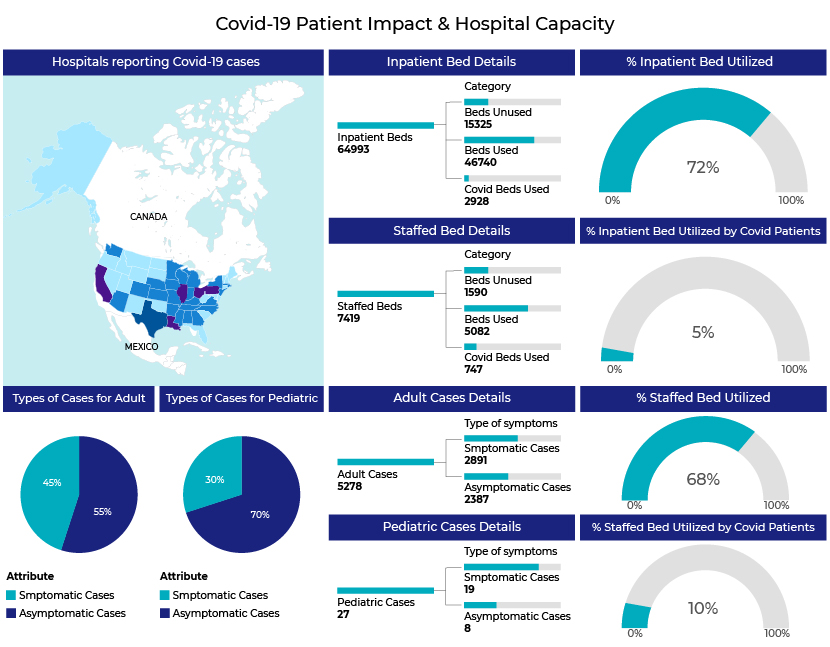
Let’s first take a look at the number of hospitals reporting utilization.
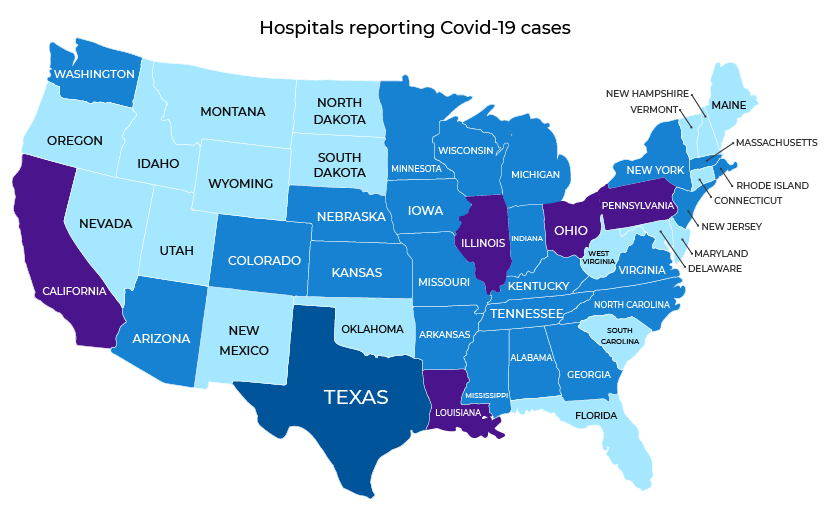
The color gradient in the map above clearly indicates that the largest number of hospitals (589 hospitals) reporting COVID-19 cases is from Texas. We continue our analysis with California, which has 398 hospitals reporting COVID-19 cases.
An analysis of the capacity and utilization of these hospitals shows that they have two main types of beds: inpatient and staffed. These are further split into beds used, unused and COVID-used. The data shows that more inpatient beds are utilized than staffed beds. However, the number of beds used for COVID cases is not that high. This means that these hospitals have most of their beds occupied by non-COVID patients.
On the other hand, when we analyze the type of patient, we see that the majority are adults. A further categorization shows that the number of symptomatic cases is higher than the number of asymptomatic cases in both the pediatric and adult categories.
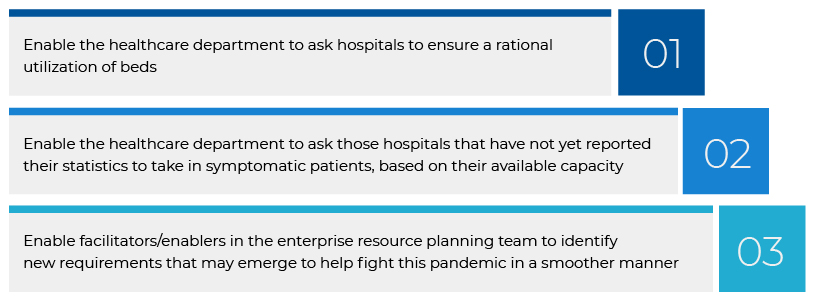
Purely based on the data sets, a preliminary conclusion can be arrived at that although more symptomatic cases are reported; the direct relationship to hospital bed utilization is low. This analysis would help in the following ways:
How Acuity Knowledge Partners can help
For over 18 years, Acuity Knowledge Partners has been providing research and analytics services to over 300 buy-side and sell-side firms located across the world. The dedicated data science practice was launched in 2019, supported by 15 years of experience in providing quantitative and technology solutions to our clientele. Acuity’s data science team of over 70 professionals works closely with 220 technologists and 2,000 analysts to provide digital insights by analyzing structured and unstructured data sets.
Bibliography:
-
https://www.datanami.com/2019/11/21/alternative-data-goes-mainstream-in-financial-services/
-
https://www.selecthub.com/business-intelligence/business-intelligence-software-market-growing/
Tags:
What's your view?

Thank you for sharing your Comments
Share this on


About the Authors

Subhajeet Kumar Roy has over 6 years of experience in data analytics across Financial Services, FMCG and Healthcare industries. He has worked extensively in business Intelligence mandates and has applied statistical methodologies to deliver critical outcomes. At Acuity, he provides business intelligence and visualization support to a leading US-based investment management firm. Prior to joining Acuity, he has worked with a Big Four accounting firm and a tier-1 consulting firm in their data analytics operations.

Vidhi Bhamra has over 4 years of experience in data analysis and visualization services across Financial Services, Healthcare and Retail industries. At Acuity, she providers data analytics, business intelligence and visualization support to a leading US-based investment management firm. Prior to joining Acuity, she worked as a Senior Data Analyst for a niche knowledge services firm in India. She holds a Master’s Degree in Economics.
 Blog
Blog
China’s imports of Japanese food products decl....
Background China has consistently been one of Japan's most important trading partners: Ja....Read More
 Blog
Blog
Activist investors – mapping the current lands....
The landscape of shareholder activism In the world of activist investing, a crucial debat....Read More
 Blog
Blog
The mystery of black swans and how to prepare fo....
In the realm of global financial markets, there exist fascinating phenomena known as “bl....Read More
Like the way we think?
Next time we post something new, we'll send it to your inbox