Published on November 19, 2024 by Shashank Jain
Gold is on track to deliver its best yearly performance (~33% YTD, as of 1st November 2024) this year, at least since 2000. This powerful rally in the gold bull market has defied the usual variables, particularly higher real yields, a stable or higher dollar index, or subdued ETF demand, which usually leads to lower or sideways price action in gold. However, gold market analysis shows that physical demand factors have outweighed these influences, particularly the significant central bank buying of gold over the past two years. Additionally, physical investments in gold, such as coins and bars, have performed well since COVID, further supporting the gold market.
Fundamental analysis of gold and other commodities has its limitations. Incorporating technical analysis provides a more comprehensive understanding of price movements and is widely utilized by commodity traders. By combining both approaches, traders can gain valuable insights into market trends and make more informed decisions.
Gold’s Bullish Cup and Handle Pattern
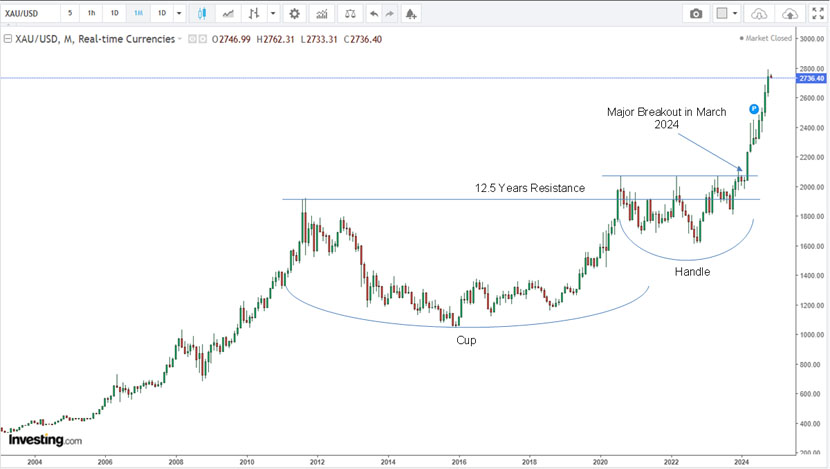
The gold rally that began in the aftermath of the 2008 global financial crisis peaked in September 2011 at approximately USD 1,900 per ounce. This was followed by a deep bear market lasting until the end of 2015, after which gold began a slow upward movement. As the Federal Reserve indicated a shift towards lower interest rates in 2019, gold started to rise, initiating a new bull market. By the pandemic in 2020, it reached a new all-time high of around USD 2,075 per ounce. The price action from 2011 to 2020 formed a downward semi-circle pattern resembling a cup.
The breakout in 2020 was not followed by sustained higher prices, as gold dipped below the 1,900 level, leading to a period of sideways consolidation from August 2020 to February 2024, forming a handle pattern. When combined, these two patterns create a cup-and-handle formation that spans 12.5 years. By early 2024, the Federal Reserve indicated the beginning of a rate-cutting cycle. After four attempts in March 2024, gold achieved a decisive breakout above the 2,075 level, confirming the cup-and-handle pattern and signaling a bullish continuation.

The price target for this pattern is determined by measuring the distance from the bottom of the cup to the breakout point and then projecting that distance upward from the breakout level. In this instance, the target is approximately USD 3,100 per ounce, indicating potential for further gains from current levels.
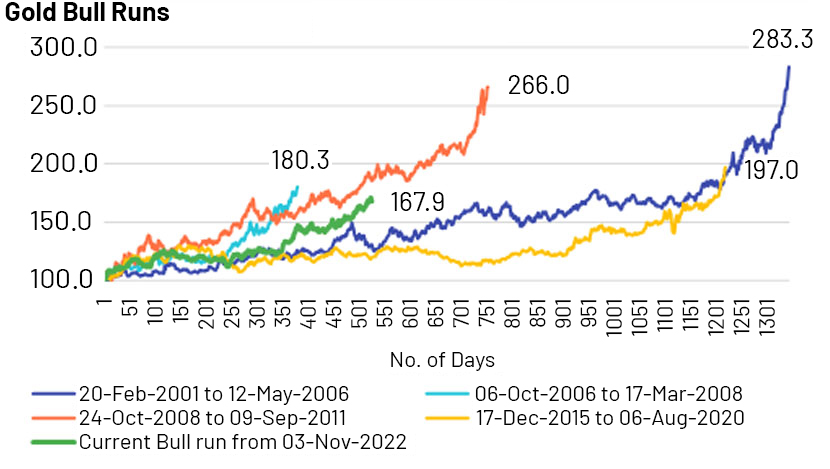
Following the generally accepted guideline that a price increase of 20% is required to declare a bull market, and considering historical gold bull markets, it appears that the current bull market still has room to grow.

Gold performs well as FED cut rates

Note: *As of November 01, 2024
A low-interest rate environment tends to be favorable for gold, as it becomes more attractive compared to bonds. Gold is a zero-yielding asset, so in a low or negative yield environment, investors often turn to gold for stability and potential price appreciation. Historically, gold has delivered strong returns both before and after the first federal funds rate cut. It performed well in the three years following the first cuts in the 2001 and 2007 cycles. In 2019 cycle, gold peaked within one year of the first rate cut, and two years later, it managed to maintain high price levels compared to the starting point of rate cuts. In the current cycle, gold has already delivered a 33% return over the past year, before the first rate cut. It will be interesting to see how it performs after the first cut in the months ahead.
Underperformance of gold miners in current cycle
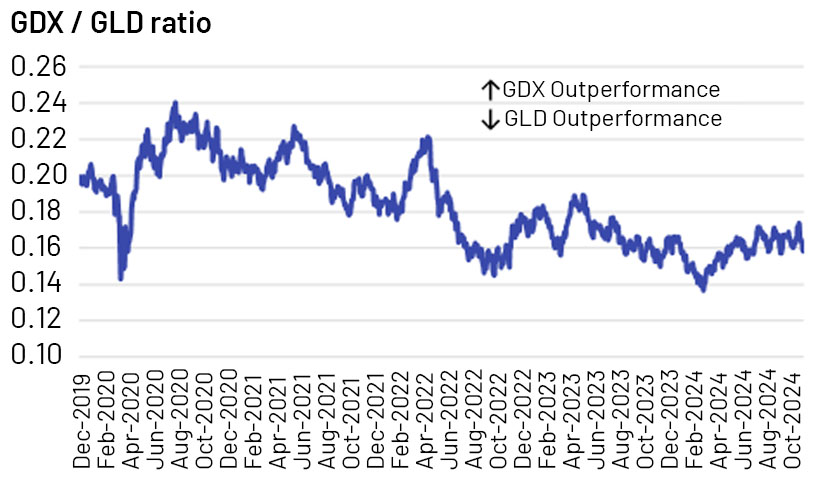
Natural resources companies focused exclusively on gold mining see their earnings closely tied to gold price trends, making gold stocks effectively leveraged investments in the precious metal. This relationship provides a useful valuation proxy, revealing cyclical patterns when analysed over time through gold technical analysis. Currently, the most widely recognized benchmark for gold stocks is the GDX VanEck Gold Miners ETF. By comparing its price to that of the GLD SPDR Gold Shares ETF, investors can gauge gold-stock valuations.
With gold reaching all-time highs, shares in precious metals mining are beginning to show signs of life. As of November 1, 2024, GDX has risen ~29% year-to-date, slightly trailing GLD’s year-to-date gain of ~32%. However, over a five-year horizon, GDX has gained ~42%, significantly lagging behind GLD’s impressive ~77% increase. The underperformance of GDX becomes even more pronounced when considering the period since August 2020, which marked gold's peak that year.

Rising operating costs over the past five years, coupled with a general skepticism about the sustainability of current gold bullion prices and their potential for further increases, are two key reasons for the underperformance of gold miners.
The key industry metric for assessing the total cost of producing an ounce of gold is All-in Sustaining Costs (AISC). This measure includes not only cash costs but also the sustaining capital expenditures necessary to maintain existing operations. According to the World Gold Council, AISC has surged by approximately 40%, rising from about USD 1,000 per ounce in 2020 to USD 1,388 per ounce in Q2 2024. This increase is largely attributable to the inflationary environment following COVID-19, which has led to higher fuel and labor costs. Additionally, cost increases such as royalties and production taxes are linked to rising gold prices. Taking these cost increases into account, the industry currently enjoys the highest margins per ounce on record.
Mining analysts at investment banks are predicting that gold will fall back below $2,000 an ounce by 2028, according to Beacon Securities—a decline of nearly 30%. This forecasted gold price is crucial for valuing mining companies, as cash flows are projected based on it. Currently, gold skeptics outnumber believers, leading to lower valuations for gold mining equities.
Conclusion
Gold has given a major breakout early this year and the ongoing FED rate cuts, until a bearish signal is indicated by technical analysis, gold is expected to rise above USD 3,000 an ounce. At the current gold price, the gold mining sector is projected to achieve record-high margins and earnings, even when accounting for rising costs, which are anticipated to plateau against a backdrop of disinflation. If gold prices remain strong, we could see a re-rating of gold price forecasts by investment banks, which would, in turn, lead to a re-rating of gold mining equities.
How Acuity Knowledge Partners can help
Acuity Knowledge Partners provide research on industry- and country-specific topics to global organisations and research houses and help them make sound decisions. We support our clients in a wide range of areas, including mergers and acquisitions, investment research, industry profiling, financial analysis, thematic research, and macroeconomic and FX research. We also help clients build databases and provide regular sector coverage. Each output is customised based on the client’s requirement. By leveraging dedicated teams of experienced analysts at our offshore delivery centres, our clients benefit in terms of operational efficiency and cost optimisation.
References:
-
https://www.gold.org/goldhub/gold-focus/2023/11/gold-miners-aisc-still-rising-slower-pace
-
https://www.mining.com/web/gold-price-surge-adds-glitter-to-tarnished-miners/
-
https://www.vaneck.com/us/en/investments/gold-miners-etf-gdx/overview/
Tags:
What's your view?
About the Author
Shashank has over 10 years of experience as an equity research analyst. He has worked with leading global organisations across domains; his sector expertise includes non-bank financial institutions (such as lenders, asset managers, brokers, exchanges, life insurers and general insurers), telecom, real estate (including REITs), IT services, software (including SaaS) and oil and gas. At Acuity Knowledge Partners, Shashank supports a global investment bank, assisting non-bank financial analysts. He is a CFA charterholder.
Like the way we think?
Next time we post something new, we'll send it to your inbox


