
Published on May 22, 2025 by Simpoo Kumar
Performance attribution in portfolio management
In investing, knowing the source of your returns is as important as the returns themselves. It is imperative for portfolio managers and investors to assess the drivers behind the investment performance. Understanding whether the gains or losses are due to smart asset allocation, superior security selection or favourable market conditions is crucial. Performance attribution analysis helps answer these questions, enabling investors to refine strategies and improve decision-making.
Portfolio performance attribution is a technique used to analyse and deconstruct a portfolio’s returns, distinguishing between active management decisions and market-driven performance. It helps investors
-
Evaluate how well a fund manager’s strategy has performed
-
Identify whether excess returns (alpha) are generated due to allocation decisions, security selection or external factors
-
Improve future investment decisions by understanding past performance
-
Effectively capture style drift, which highlights divergence from the portfolio mandate
Delving into the different approaches of performance attribution analysis
The right approach to choosing the performance attribution analysis model depends on the asset class mix. Each model captures performance drivers unique to the respective asset class. We explore a few key approaches suited for different security types below.
1. Brinson attribution
This is a returns-based performance attribution analysis method, especially for equities. It divides returns into three effects:
-
Allocation effect – Shows how overweighting and underweighting certain sectors versus the benchmark impacts portfolio performance
-
Selection effect – Shows the extent to which the returns were influenced by selecting the right or wrong securities within those sectors
-
Interaction effect – Shows the combined impact of allocation and selection decisions
A simplistic example of these effects is demonstrated below.
Following is the portfolio and benchmark composition along with returns:
| Sector | Benchmark weight (%) | Portfolio weight (%) | Sector return (%) | Portfolio stock return (%) |
| Tech | 30 | 50 | 12 | 15 |
| Banking | 40 | 30 | 10 | 9 |
| Energy | 30 | 20 | 8 | 7 |
Interpretation:
-
Allocation effect: The portfolio manager overweighted the tech sector (50% vs 30%), and sector returns outperformed, adding value to the portfolio manager’s asset pick versus the benchmark
-
Selection effect: Within the tech sector, the portfolio manager chose stocks that performed even better than the sector (15% vs 12%), which also had a positive effect
-
Interaction effect: Positive, because both allocation and selection worked in our favour
2. Campisi model attribution
The Campisi model, developed by Stephen Campisi, is a portfolio performance attribution approach suited for fixed income portfolios. It splits returns into the following components:
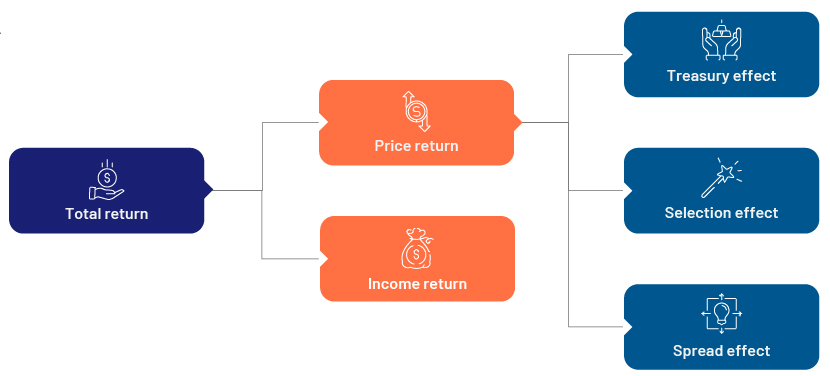
-
Income return: This reflects the coupon payments earned from holding the bonds. It forms the most stable and predictable part of fixed income returns.
-
Price return: This captures changes in bond prices due to market fluctuations. It is broken down further into three distinct attribution effects:
-
Treasury effect: This isolates the impact of interest rate movements on bond prices using duration-matched Treasury benchmarks. For instance, if Treasury rates rise, bond prices typically fall, resulting in a negative Treasury effect.
-
Spread effect: This measures how changes in credit spreads affect bond prices. When spreads widen due to rising credit risk, bond values decline, and this leads to a negative spread return. Conversely, tightening spreads lead to capital gain.
-
Selection effect: This attributes the portion of price return arising from security-specific decisions such as choosing outperforming or underperforming bonds relative to their sector or rating peers.
-
Let’s consider a scenario where a portfolio holds US high-yield corporate bonds during a period of rising interest rates and widening credit spreads. Some of the attribution effects are explained below:
-
Price return: As interest rates rise, bond prices drop, causing a negative return from the price impact.
-
Spread return: Credit spreads widen due to increased borrowing costs; thus, the spread return in this scenario is negative.
3. Factor-based attribution
Factor-based models is a form of performance attribution analysis that breaks performance down into key investment factors such as the following.
-
Market beta: general market exposure
-
Value: investing in undervalued stocks
-
Growth: investing in companies with high earnings growth
-
Momentum: riding the wave of stocks that have been performing well
-
Size: small-cap vs large-cap stocks
Let’s understand the market beta component using the following example:
Assume beta of the portfolio is 0.8.
-
Portfolio return: 12%, benchmark return: 10%
-
Expected return from market exposure = 0.8 * 10% = 8%
-
Portfolio return = 12%, so active return = 12% - 8% = 4%
-
Market beta explains 8% of the portfolio return, meaning only 4% is due to active management
Interpretation: Most of the returns are driven by overall market movement rather than by stock selection.
Understanding surprise return in the attribution model
In some attribution models, a surprise return component is included to capture the impact of deviation between actual outcomes and model assumptions. This return arises when the actual parameters are different from the attribution model assumptions.
Using a mortgage-backed security (MBS) as an example, say the prepayment model for the MBS considers a 2.5% prepayment. If the actual prepayment is 1.5%, the difference in the prepayment return attributed to this would be reported under surprise return. Another example would be of an inflation-indexed bond trading at a price consistent with projected inflation for the following month of 4%. If actual inflation is 3.5%, this difference of (4% - 3.5%) *(1/12) = 4.2bps would be the inflation surprise return to reflect the inflation accretion accumulated over the months based on the model’s projected rate.
Leveraging quantitative models for attribution studies
The current data-driven financial landscape has led to the rise of sophisticated quantitative models, transforming performance attribution from a simplified return breakdown into a nuanced analysis of what drives performance.
By using econometric and time series models, portfolio managers can dissect performance into identifiable sources, such as market movements, sector trends and security-specific factors, and measure the significance of each. This allows for more informed decision-making and better alignment of portfolios with strategic objectives.
Examples of key quantitative approaches:
-
Multi-Factor models: These help us understand the source of returns with more granularity. These models break down portfolio returns into a range of economic, sectoral and style-based factors such as value, growth, momentum and volatility. This helps distinguish whether outperformance was due to smart asset allocation, effective security selection or favourable market conditions; for example, a portfolio overweight in technology stocks may have outperformed due to sector strength (allocation effect), but a multi-factor model can further determine whether specific stock picks (selection effect) contributed to that success.
-
Machine learning and AI: AI-driven models help analyse complex, non-linear patterns that are often outside the purview of traditional models. With the increased capacity of computers to handle vast amounts of data, portfolio managers have advanced machine-learning models incorporating linear regression at their disposal to extract useful information with much more granularity. Additionally, there are sentiment analysis models to gauge overall market sentiment such as BloombergGPT and IBM Watson, which analyse news articles, earnings calls and social media data to track investor sentiment.
Understanding performance attribution in the context of diverse market conditions
As the market switches regime, it becomes crucial to know the source of returns. The portfolio manager’s knowledge of market and macroeconomic factors, coupled with their expertise in selecting stocks and allocating appropriate weightage of capital, can lead to substantial benefits.
In bullish markets, portfolio managers may choose to select growth stocks and increase tactical speculation to ride the market wave. However, in bearish markets, they may go for diversification and select stocks with strong fundamentals, prioritising defensive positioning and resilient stock-picking to fortify portfolios against downside risks.
Performance-attribution tools come with their own set of challenges
The following need to be monitored carefully to ensure reliable attribution analysis.
| Challenge | Description |
| Data accuracy and availability | Incomplete, outdated or inconsistent data can distort attribution results. Mispriced securities or incorrect weightings may lead to misinterpretations. |
| Benchmark dependency | An inappropriate benchmark can mislead the analysis. For example, comparing a global equity fund to a domestic index misrepresents both allocation and selection effects. |
| Impact of currency and fees | For international portfolios, currency fluctuations can mask true performance. Similarly, gross vs net-of-fees returns can create a misleading picture of manager value. |
| Oversimplification | Basic models may ignore complex strategies such as derivatives, hedging or dynamic asset allocation, leading to misattributed returns. |
Final thoughts
As the investment climate continues to go through multiple changes the importance of performance attribution analysis continues to grow. Financial engineers are becoming increasingly innovative with financial product development. Legacies of attribution models are being carried forward by complex econometric models in the form of machine-learning models, enabling portfolio managers to dive deeper into granularity to the source of return.
How Acuity Knowledge Partners can help
Our SMEs offer tailored research, analytics and technology solutions to investment houses.
Our services encompass investment research, portfolio performance attribution and risk monitoring with in-depth analytics supported by proprietary technology. By leveraging these capabilities, we help clients conduct performance attribution for their investment portfolios to validate strategy speculations, providing detailed analysis of investment strategies and returns, providing useful insights on unexpected sources of risk and performance to help rebalance portfolios accordingly.
Sources:
What's your view?

Thank you for sharing your Comments
Share this on


About the Author

Simpoo Kumar, Senior Associate - Simpoo has over four years of experience in risk reporting and analytics. At Acuity Knowledge Partners, he supports investment houses with portfolio risk analysis which involves data quality checks, analytics computations, reporting and automation solutions. Simpoo has completed his master’s degree in economics from the University of Hyderabad and has a keen interest in quantitative finance.
 Blog
Blog
Why positive and negative ESG screening are cruc....
The concept of screening, although having been around for decades, has gained momentum in ....Read More
 Blog
Blog
Wellness industry trends – 2023....
The wellness market has been around for a while. From the days of Jane Fonda’s workout t....Read More
 Blog
Blog
Part 3: Reporting and data analysis in VOC....
Unlocking organisational success with the Voice of the Customer programme (an 8-part serie....Read More
Like the way we think?
Next time we post something new, we'll send it to your inbox