
Published on February 27, 2024 by Siddhartha Raj Khare
Tableau has established itself as one of the key players in visual analytics over the past decade[i]. Its adoption has not only helped enterprises analyse key business decisions and outcomes in a data-driven manner, but also provided stakeholders with the tools to deep dive into data and understand underlying trends, patterns and key signals. Acuity Knowledge Partners has designed, developed and deployed self-service Tableau dashboards that have helped banks, asset managers and other financial services clients make the most of their data.
Despite its ease of use, Tableau practitioners constantly need to innovate when dealing with real-world data, which is often far messier. At times, one cannot always answer all key questions from a single dataset – multiple datasets may need to be integrated to uncover the most powerful insights. One of our clients wanted to visually compare revenue for the current and previous years, and year-over-year changes in revenue, to identify revenue trends across regions and products. While this request seemed straightforward initially, the primary challenge arose from storage of data in different data sources. While the current year's data was stored in one database, historical data was stored in another. The solution was to consolidate (or unite) all the relevant data in one source.
In this blog, we explore a scenario where datasets available in different data sources need to be combined (specifically, “united”). We present Tableau practitioners with an effective solution to resolve this issue, as there is still no straightforward solution to enable cross-database unions on Tableau Desktop[ii].
Tableau does not support cross-database unions, but it does support cross-database joining for nearly all data sources[iii]. We leverage this feature along with the concept of data scaffolding[iv] to build a workaround that would ultimately give the same results as those from combining the data.
To explain how this works, we illustrate it using a real-life scenario: Consider a sample revenue dataset in Excel (we call it Excel_Data) and another revenue dataset residing within Google Cloud (we call it BigQuery_Data). Both datasets contain the identical fields: “Month” and “Revenue”, as shown below:
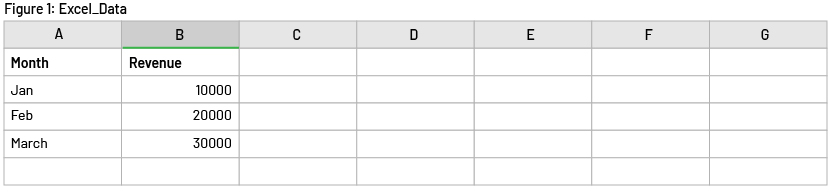
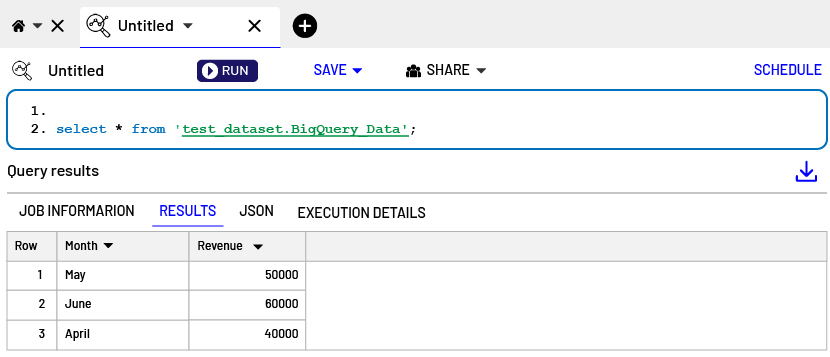
Figure 2: Google BigQuery_Data
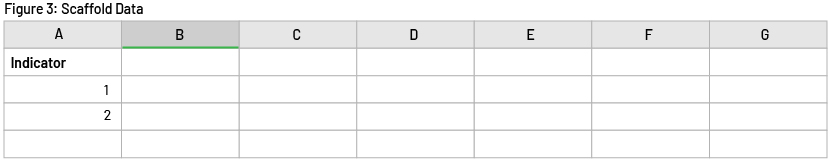
First, create a scaffold data source (let’s call it Scaffold Data) in Excel, with two unique values (to perform a “union” operation on the two data sources), as the following figure shows. This data source will be used as the left-hand side of a cross-database join. If you need to unite more data sources, simply add more rows with unique values.
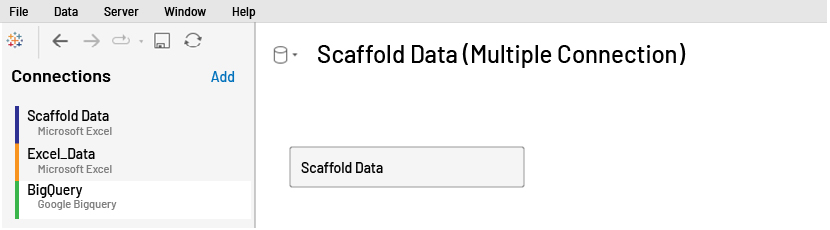
Next, open Tableau Desktop and connect to Scaffold Data. Add Excel_Data and BigQuery_Data as new connections.
Figure 4: Data source connections
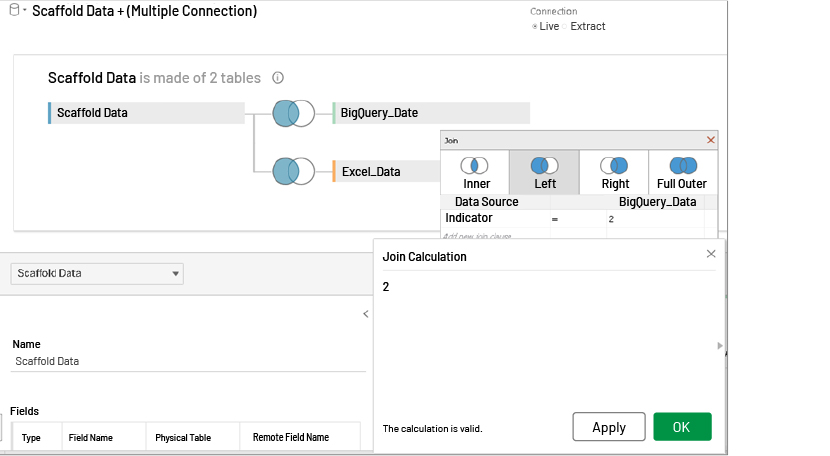
Go to the physical layer[v] in the data source tab and drag the Excel_Data and BigQuery_Data sheets to the canvas one by one. To join the datasets with Scaffold Data, select the “Indicator” field from Scaffold Data and create customised join calculations, with value “1” for Excel_Data and “2” for BigQuery_Data, as shown in the figures below. Then select the “Left Join” option in the join dialog box to join the datasets on Scaffold Data to the left-hand side.
Figure 5: Joining Scaffold Data and Excel_Data
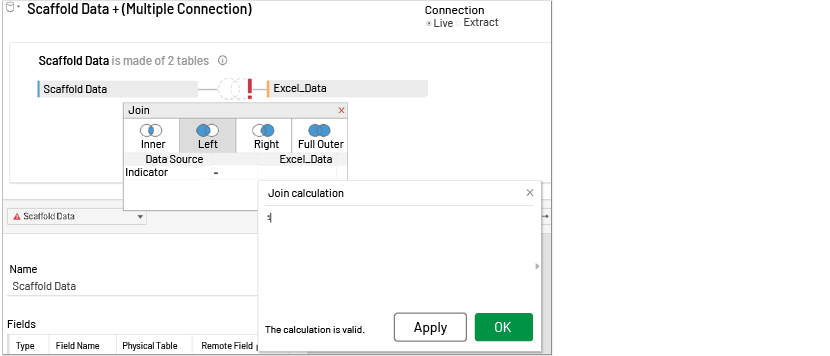
Figure 6: Joining Scaffold Data and BigQuery_Data
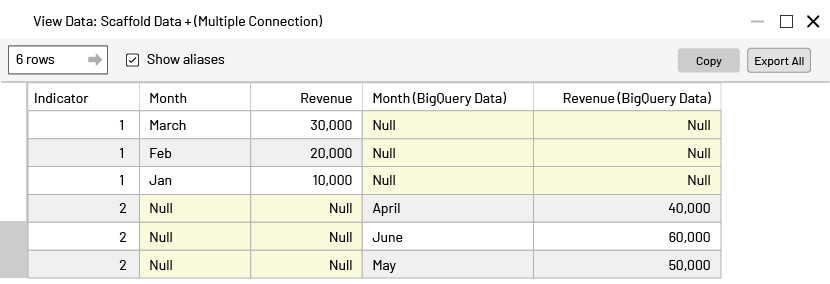
Now we have data from the two data sources in one place. We can validate it by viewing the underlying data as shown below.
Figure 7: Underlying data
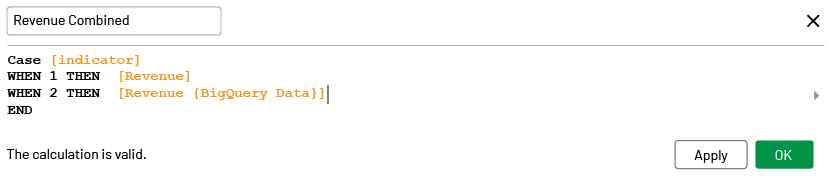
To access all the values from a particular field after the union, create combined fields by setting up calculations using the “Indicator” field from Scaffold Data as shown below.
Figure 8: Month Combined field
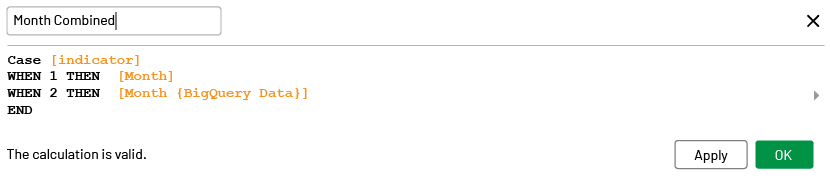
Figure 9: Revenue Combined field
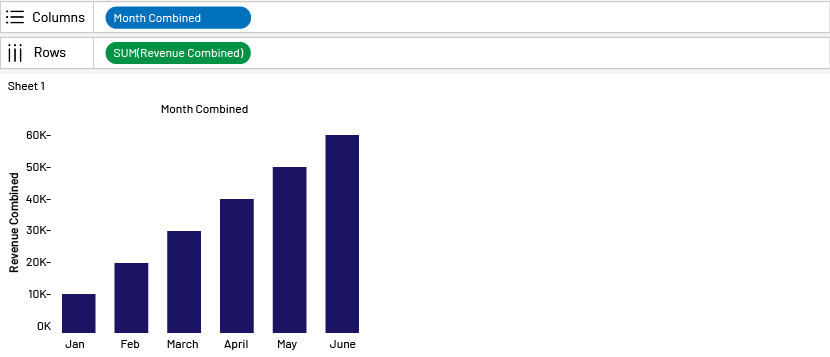
Now drag the “Month Combined” and “Revenue Combined” fields to the column and row shelf to view it. We have successfully created a union between two different data sources, as the following figure shows.
Figure 10: Revenue Combined against Month Combined
Conclusion
This approach is especially beneficial in scenarios where a Tableau practitioner lacks the necessary access or privileges to perform the union at the data-source level. This approach is also helpful when one needs to develop the dashboard without introducing a dependence on an additional ETL tool. That said, we expect this to be rolled out as a native feature in future releases of Tableau.
For more details on how Acuity can help in your data and technology initiatives, you can refer to our financial services technology consulting solutions
References:
-
[ii] https://help.tableau.com/current/pro/desktop/en-us/union.htm
-
[iii] https://help.tableau.com/current/pro/desktop/en-us/joining_tables.htm#ase-joins
-
[v] https://help.tableau.com/current/online/en-us/datasource_datamodel.htm
What's your view?

Thank you for sharing your Comments
Share this on


About the Author

A tableau certified professional having 6+years of industry experience in designing and providing analytical solutions across various industries using Tableau ,Alteryx, SQL and Python.
 Blog
Blog
Instrument data infrastructure – Its importanc....
A robust and comprehensive database is a basic requirement for a financial firm’s system....Read More
Like the way we think?
Next time we post something new, we'll send it to your inbox